Dude NMS
This manual describes the operation of Dude version 1.0.
Contents
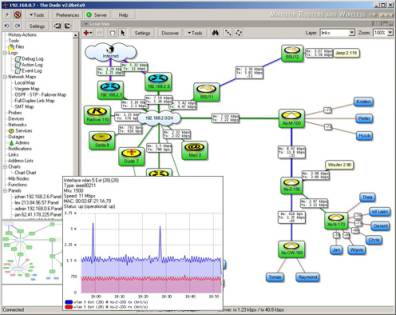
What is the DudeThe Dude is a visual and easy to use network monitoring and management system designed to represent network structure in one or more crosslinked graphical diagrams, allowing you to draw (includes automatic network discovery tool) and monitor your network however complicated it might be. The Dude is capable of monitoring particular services run on the network hosts, and alerting you about any changes in their status. It can read statistics from the device monitored and show you graphs of the monitored values, allows you to test and connect to the devices easily, and provides some very basic RouterOS configuration tools.
It is written in two parts:
- Dude server is the actual program, which runs in background. It does not have any graphical interface, and may only be controlled by a Dude client application located either on local machine, or anywhere on the network. There is also a web interface to basic functionality, mostly designed as a quick and accessible review tool, not a full-fledged configuration application.
- Dude client may connect to the local or a remote Dude server, and is used as a graphical interface to it. That means that every action is really executed on the server machine and the client is just showing pictures. Thus, user window layouts are stored on the server and are not lost on disconnect.
System Requirements
- RAM: minimum - 64MB, recommended minimum - 128M
- OS: Windows 2000/XP (does not work with Windows 95/98/Me) with Administrator permissions
- Video: at least 800x600
Getting Started
When you first start the Dude client, it launches the local server and automatically connects to it. Then you can disconnect and choose another server to connect to. You should remember that the client only works when connected to an either local or remote server.
If you do not have any Dude server running yet, you should start it. There is a button on the top of the application window called “Server”, which has indicator of whether the local server is running (it is green if the local server is running). If you press it, a new window will appear that allows you to start/stop the local Dude server, as well as completely reset its configuration.
When a server is started, you can connect to it pressing the Connect button. There are three connection modes:
- local – to connect to the local Dude server (note that this option will not work for Linux users running the Dude under Wine, you should use remote connection to 127.0.0.1 host instead to connect to the local Dude server)
- remote – to connect insecurely (nothing is encrypted, not even passwords) to a remote Dude server
- secure – to connect securely to a remote Dude server
Remote connection by default is using TCP 2210 port in regular mode or TCP 2211 port in secure mode, so make sure these ports are not limited by a firewall. The ports may be changed in the server's Global Settings menu. The default username for connecting to a server is “admin” with no password. You can change this later.
Note for Linux users: you should start the Dude from the root user (or delegate some permissions to your regular user), or else the Dude will not be able to ping hosts.
Graphical Interface
The interface has two panes. The first (left) pane is used to select a configuration section, and the second (right) – to display the configuration window. At the top of the selection pane, there are five buttons:
- Undo reverse the previous configuration action
- Redo repeat an undone configuration change
- Settings configure global settings of the server, which will be described later on
- Export export all the server configuration to an XML file
- Import import the server configuration from an XML file
There is a network mini-map at the bottom of the left pane, displaying a scaled-down view on the active map, which can ease navigation on large network maps.
There may be many windows on the window pane. Each of them may be split in two either horizontally (empty left half - ; empty right half - ), or vertically (empty top half - ; empty bottom half - ) using buttons on the top of each internal window. By double-clicking on an entry in the selection pane, the chosen configuration window will be open on the top half of the window pane, zooming the existing windows of the pane to the bottom half. Any configuration pane entry may be dragged-and-dropped onto an existing window or selected with the drop-down list at the top of each window, and the chosen tool will replace the existing contents of the window. The size of any window may be easily resized by moving its borders, in which case all other windows will be zoomed accordingly.
Network Maps
The Dude is created to manage networks graphically, so the main interface to the program is the graphical network representation, i.e. network map. You can instruct the program to detect all your network devices automatically by specifying the IP address range it should scan. The Dude is capable of reading network configuration of the devices that support SNMP protocol, and, thus, is able to make recursively scan the networks connected to the already discovered network devices (up to the specified recursion level). It can even detect “smart” switches and bridges that provide link information over SNMP. You may divide the network into separate interlinked network maps.
There are two mouse cursor modes:
- Grabbing tool – enables you to move the map by moving mouse cursor while holding left mouse button pressed, instead of being required to move using scroll bars. Double-click opens device properties.
- Pointer tool – default cursor mode, when single mouse click selects an object. Moving cursor with left mouse button pressed selects more than one object (if mouse button was pressed above the free space on the map) or moves the selected object(s) (if mouse button was pressed on an object or a group of them). Double-click opens device properties.
Left click on an object brings up a menu, where you can modify the object properties, as well as run device tools. Mouse wheel is used to zoom in/out the map.
The maps are built with the following objects:
- Device – network host with a unique IP address that runs one or more identifiable services, its status may be monitored by.
- Network – network cloud that represents one or more IP networks. It usually identifies a network connection of a host (i.e., dedicated network interface of a network device) and represents OSI layer 2 interconnection between network devices.
- Submap – wormhole to another network map. This is useful for splitting one big map into many smaller and more readable ones. Double-clicking on a submap link, will activate the map the link is pointing to; if the target map has a reverse submap link, the map view will be centered on that.
- Static – generic grouper of network hosts. You can link any object to this, without any effect except that you will show that the objects are somehow connected.
- Link – connection between two objects on a map, that represents OSI layer 1 physical link. It can display traffic statistics if set to use SNMP protocol (in this case, you will need to specify the device and the particular network interface to monitor). Depending on utilization, it may change its color, signaling that the channel is almost full. There are various link types (styles), which represent different kinds of links: VPN, wireless, etc.
- Dependency – monitoring dependency. If a device depends on another, it is not monitored until that, it depends on, is up.
On the map, you can select whether you want to see link diagram (all the network connections), or dependency diagram.
When navigating through a map, if you leave the mouse cursor over a network object for about two seconds, a tooltip will appear, showing some information on that object. Network devices will also have reachability time graphs for each service (like ping time). Submaps will have the list of elements and a map preview shown.
The map may be automatically aligned by pressing the “Layout button”. You can also align some selected objects in line with the the automatic alignment tools:
- Line tool – place the selected items in one line. First press the left mouse button at the beginning of the line, release the mouse button at the end of the line.
- Arc tool – align the selected items in an arc. First press the left mouse button at the starting point, release the mouse button at the ending point. Then you can change the curvature by moving the mouse cursor. Click once more to apply.
Device Representation
Each device is displayed as an icon related to a certain device type (fully customizable), which defines the list of services a device should have to be classified to a particular type. The discovery procedure, when adding a device, once detects all the services running on it, consults the device type table.
Each device has the table of all network services once found for the device. You can add and remove new services from any device. The services are constantly monitored, and the ones failed to respond are marked in this list. It is possible to configure a set of "parents" (dependency tree) for a device, so that the device is only monitored if at least one of the parents is reachable. You can set polling preferences (polling frequency and timeout for service probes) and select a notifier (procedure to undertake when the status of any probe is changing, like open a popup window, beep, send an email or execute a program) for each device, as well as for each particular service.
There is history, graphs and some SNMP information available as well.
Configuration
Global Settings
- General
- DNS: primary and secondary DNS servers to be used by the Dude server to resolve DNS domain names.
- SMTP: primary and secondary SMTP servers to be used by the Dude server to send out email. The “From” email address should also be set.
- SNMP: the default SNMP protocol settings
- Polling: server default settings of how often (interval) to poll each service, and how long to wait for it to respond (timeout), as well as choose the default notifier executed should a service fail.
- Server
- Dude remote: whether to accept remote connections, on which port to listen, and what networks to allow to connect from
- Web access: whether to accept remote connections via web interface, on which ports to listen (HTTP and HTTPS protocols), and what networks to allow to connect from. Additionally, you can change the information update frequency in clients' browsers (refresh interval) and the client inactivity period, after which the web client would be considered logged off (session timeout).
- Map Defaults (used when no specific settings are made for a particular map or a device)
- Background color
- Map object (device, network, submap, static, link, dependency) appearance: label and tooltip contents, shape and font for an object. Some internal variables (like IP address) may be used in label and tooltip contents, which may be selected out of the “Insert Variable” dropdown list. The variables will be described later in this document.
- Chart Appearance: background, grid, text colors, text style, line colors
- Discover Defaults (used when no specific settings are made for a scan)
- Black list: address list to exclude from scanning
- Name Preference: which device name should be used. The discovery procedure may define the device name by its IP address, DNS name or the string returned as the device name by SNMP protocol. In this field you set, which one of thee names should be used. For example, if the field is set to “DNS to SNMP to IP”, then DNS name will be used when available, if it is not, then SNMP-derived name will be used, but if neither of them are detected, then IP address will be used as the device name.
- Mode: scan method. May be either “fast”, when devices are discovered simply by pinging sequentially all IP addresses from the network provided; or “reliable”, when not only pings are performed, but also all other services defined.
- Recursive hops – whether to scan recursively all the networks found connected to the initially discovered devices. I.e., in case there were some network devices detected which are connected to more than one network, whether to continue scanning also the network these devices are connected to. This parameter is set to the maximal hop (network device) number, which to scan the connected networks from.
- Advanced
- Identify device type – whether to assign the type for each device discovered based on services available automatically.
- Add networks – whether to add “network” objects to the map based on found network connections.
- Add links – whether to show interconnection between the found devices by adding links to the diagram.
- Layer 2 Structure - try to discover and display SNMP-compliant switches and other layer 2 devices, which some of the network devices are connected to.
- PPP Links.
- Graph Service Poll Times - display service polling times on the graphs.
- Graph Link Bit Rate - display link bitrates on the graphs
- Max simultaneous – maximal number of connections established simultaneously. Some firewalls may limit number of outgoing network connections, so you need to show the effective maximum here.
- Services – the list of services to try to discover for each network device found. You can disable some services from being discovered (for example, the random “rnd 50:50” service most probably should be disabled)
- Item placement settings: specifies the dimensions of each map element in pixels (assumed item width/height), as well as element number in groups. Items are placed in clusters of the defined number of elements (big row/column). These clusters are, in turn, grouped in a larger group (large row/column). The elements fail to become part of that large group are just thrown one on another and should then be displaced manually. Note: there also is an automatic layout tool (button) to move the elements into tree-like diagrams.
- Misc
- Undo Queue Size - number of action history steps to allow undo for
- Ask Confirmation When Removing - whether to ask confirmation when removing
Tools
You may customize the list of tools, which may be executed for a device. These usually include telnet and HTTP access, ping, ftp and so on. You can add new tools, specifying that command to execute. Just like for map object labels, internal variables may be selected and used here.
Some built-in tools can not be deleted. Note: these tools are not used to probe whether a device is alive, but for administrator's convenience to connect or test the devices manually.
Files
List of the files uploaded to the server, like images for network map backgrounds and sounds for notifications. You can also remove files from the server.
Logs
List of all available log threads (and the subentries of this menu let you choose a particular log thread to view). For any particular log thread you can configure, how many lines should be shown (buffered entries), how often to start a new file for the thread and how many files to keep. You can filter only some entries out of a thread by writing a regular expression and pressing [Enter] key or “Apply” button. The regular expressions are saved in the drop-down menu, so you would not have to rewrite complex expressions each time you want to use them.
There are three log threads:
- Debug – shows all changes happening in the system
- Action – lists manual operations performed by an administrator (for example, device add/remove events)Event – stores network events (for example, information about failing services)
Note: this is different from the “Log files” menu, which shows actual files on disk, whereas this menu shows logging targets.
Probes
List of all available probe types used to check if a particular service is running on a device. The following probe types are available:
- ICMP – regular ping. Configurable parameters are packet size, TTL (time to live), retry count and timeout.
- Random – the check is considered to be successful with the given probability.
- TCP – a test, which opens a regular TCP connection to a given port. You may choose whether it is enough to check if a remote host in answering on that port, or you want to perform a conversation with it, specifying what to send and what to expect (defined in regular expression form) from it.
- DNS – probe the given UDP port (usually, 53) with a valid DNS request for the given domain name. You may also choose to check whether the response contains at least one of the specified IP addresses.
- SNMP – check the specified OID for a value. Configurable parameters are SNMP port (161 by default), OID number, OID type, comparison operation (depends on the OID type selected: numeric operators for integers, string operators for strings) as the value to compare to.
Devices
List of all the devices drawn on any of the network maps (type of the devices displayed and map they belong to may be chosen). You can not add devices here (to create a new device, you should place it on a map), just see all of them in a single list, remove them and change their settings (by double-clicking on a device):
- General tab:
- Name – device name determined according to the discovery settings, or any text string administratively set (default is IP address).
- Addresses, DNS names, lookup, lookup interval: device address information. A set of IP address and DNS names may be assigned to a device. Either primary IP address (lookup=name to address) or primary DNS name (address to name) is resolved regularly (with the given interval) from the other.
- Type – device type.
- Parents - device dependency. The device is only polled if at least one of the parents is up.
- SNMP community and port: SNMP access information for this device.
- Username, password: user credentials that can be passed to some device tools (from the built-in tools, only winbox supports it for now).
- Secure Winbox Port - use secure winbox connection to this device
- RouterOS - whether this device is RouterOS
- Polling tab: probe interval, probe timeout, probe down count, notification: service polling properties that override the server default ones and the map default ones. Define how often (interval) to poll each service, and how long to wait for it to respond (timeout), as well as choose the default notifier executed should a service fail.
- Services tab: list all the services present on the device. You can add a new service probe from the list to the device, as well as change TCP port, probe interval and timeout, and notification type here for each service independently. The “Discover” button will probe all known services. Service status (up, down or unknown) is displayed for each service listed here.
- Outages tab: log of all events when a service went down.
- SNMP: some information got using SNMP protocol, like the list of interfaces, addresses, routes, load average, etc.
- RouterOS: some basic configuration tools for RouterOS, that allow to enable/disable interfaces, add/remove IP addresses, as well as upload files and RouterOS packages.
- History: graph that shows how the number of active services change over time.
Right-click on a device brings up a list of additional options, most notably the device tool list that is easily customizable in the respective control window (select “Tools” from the configuration plane).
All
This list contains all the discovered devices.
RouterOS
This list only contains the RouterOS devices. It displays additional version information for these devices, as well as provice an easy way to upgrade some or all of them.
Group
You can as well group some RouterOS devices into device groups, which make it easies to upgrade a set of routers all at once.
Device types
Device classification types used by the discovery procedure or assigned to some devices manually. Each entry defines how the devices of that type will look like: icon and scaling. “Identification” and “Services” tabs are used only by the discovery procedure to determine whether a device found is of that type, and which services to probe afterwards:
- required – any device of this type must have the selected services active for the discovery procedure to determine the device is of that type.
- allowed – the list of other services the procedure will probe on the device. All services from this list that are active on a device will be added to the service list of the device.
- ignored – the list of services that although used for initial discovery, will not be added to the service list of the device. For example, it has been found that HP JetDirect devices may sometimes restart printing out an unwanted test page, when scanned too often on their telnet and SNMP ports, so these services, although used to detect the type, will not be watched later.
URL, which can be used later as an internal variable, may be specified for each device type.
Networks
List of all network segments places on the map. One network object may have more than one IP network associated to it. You can remove networks and change their settings here, but you can not add anything here. To create a new network, you should place it on a map.
Services
List of all the services present on each device. You can add and remove service probe from any device, as well as change TCP port, probe interval and timeout, and notification type here for each service independently. Service status (up, down or unknown) is displayed for each service listed here. Outages tab contains the log of all events when a service went down.
Outages
Outages table contains the combined log of all probe failures on any of the devices went down and lists whether a service is still down (and for how long time), or the problem has been resolved.
Admin groups
This menu lets you configure access permissions for administrator groups. Permissions are one or more from: read (read-only access to everything), write (change configuration), local (access the server locally), remote (access the server remotely), web (access the server using web interface).
Admins
List of all administrators that have access to the server. Each user must be allocated with permissions given by a admin-group. You can also restrict user access to a particular network.
Active Admins
List of the current user sessions.
Notifications
Notification types executed if a service changes its state (you can select one notifier for a service). Arbitrary applications may be launched on an event with some parameters either on server, or on all the connected clients. Other notification types include sending email, sending a syslog event (to a dedicated syslogd server), showing a popup window, flash the screen, and play a sound (WAW file, which can be uploaded on the server). The hours during which the notification will be active may be set for each weekday, so you may disable it during non-working hours and weekends.
Links
List of all the links drawn between map objects. You can only remove and configure links here, use network diagram to draw them. For each link you may choose the primary device it is connected to (network does not count as a device, so most links will have only one device to choose, but if you connect two devices manually, you will be given that choice), and the type:
- Simple – just draw a line between the objects.
- SNMP – use SMNP protocol, if supported on at least one of the objects connected. This will allow you to choose the network interface to monitor traffic on. The SNMP statistics will be shown as a small box placed over the line between the objects.
Address Lists
You can define address groups that can be used to exclude some addresses from discovery procedure.
Network Maps
Working with the program mostly happen on the network maps, which represent your network graphically. You can add objects manually (the configuration options of each of the possible map object has been described earlier) or run automatic discovery with the following options:
- General tab:
- Scan networks – list of the networks you want to scan
- Add networks to auto scan – whether to add all the found networks to auto-scan list, which mean that the networks will be automatically rescanned periodically
- Device name preference – which device name should be used. The discovery procedure may define the device name by its IP address, DNS name or the string returned as the device name by SNMP protocol. In this field you set, which one of thee names should be used. For example, if the field is set to “DNS to SNMP to IP”, then DNS name will be used when available, if it is not, then SNMP-derived name will be used, but if neither of them are detected, then IP address will be used as the device name.
- Mode – scan method. May be either “fast”, when devices are discovered simply by pinging sequentially all IP addresses from the network provided; or “reliable”, when not only pings are performed, but also all other services defined.
- Services tab – defines the list of the services for the discovery procedure to to scan for.
- Advanced tab:
- Identify device type – whether to assign the type for each device discovered based on services available automatically.
- Add networks – whether to add “network” objects to the map based on found network connections.
- Add links – whether to show interconnection between the found devices by adding links to the diagram.
- Recursive hops – whether to scan recursively all the networks found connected to the initially discovered devices. I.e., in case there were some network devices detected which are connected to more than one network, whether to continue scanning also the network these devices are connected to. This parameter is set to the maximal hop (network device) number, which to scan the connected networks from.
- Max simultaneous – maximal number of connections established simultaneously. Some firewalls may limit number of outgoing network connections, so you need to show the effective maximum here.
General configuration for a map (accessible with the “Settings” button):
- General tab:
- Name – a distinctive name of the map
- Probe interval, probe timeout, notification: service polling properties that override the server default ones. Define how often (interval) to poll each service, and how long to wait for it to respond (timeout), as well as choose the default notifier executed should a service fail.
- Autoscan – the list of networks to scan automatically with some intervals. You can add, remove and change settings of such networks. The parameters are the same as for discovery procedure.
- Appearance tab:
- Background color
- Map object (device, network, submap, static, link) appearance: label and tooltip contents, shape and font for an object. Some internal variables (like IP address) may be used in label and tooltip contents, which may be selected out of the “Insert Variable” dropdown list. The variables will be described later in this document.
- Image – the background image for the map.
Dude as a windows service
This is a general how to, for running dudes as a windows service...
First question: why would you run dudes as a windows service???
Verry simple: dudes is a ideal program for network monitoring, but if you want good network monitoring, you need a server for this. The problem with dudes at the moment is that it requires a user to be logged on, if you log off it terminates dudes. running dudes as a service enables you to have dudes running on one server, and use a client to connect to it. Never again look at your dudes server, it will be running, and doesn't need logging in.
this is how you do it...
Find a copy of srvany (you can get it for free on the MS site) Copy SRVANY.EXE and INSTSRV.exe to your system folder (c:\windows, c:\winnt)
Issue the following command in a dos prompt...
INSTSRV dudes c:\winnt\srvany.exe
This will create a windows service called dudes, but it still doesn't do anything. set it to automatic startup in the service console, in the administrative tools section. also do not enable "Allow Service to Interact with Desktop" this is gives you some enoying windows. Choose your service restart policy, i do a restart service if dudes terminates for some reason.
Now open regedit and go to this key:
HKEY_LOCAL_MACHINE\SYSTEM\CurrentControlSet\Services\dudes
create a 'Parameters' key under this reg key.
now in HKEY_LOCAL_MACHINE\SYSTEM\CurrentControlSet\Services\dudes\Parameters create an 'Application' value of type REG_SZ and specify there the full path of your app executable (including the extension). for example C:\Program Files\Dude\dudes.exe
now go to the services console and start you dudes service. use dudesw to open a client console on your server and manage your dudes service... don't forget to enable secure connection to your dudes server so you can use your dudes client to access it from remote... log off your server, and dudes will still be running, monitoring everything.
Appendix A. Internal variables
Device variables
Set in device properties; available in “Tools”, “Device Types” and “Notifications” menus, as well as in tooltips and labels:
- Device.Name – device name
- Device.FirstAddress – first IP address of the device
- Device.AddressesCommaList – comma-separated list of the device IP addresses
- Device.AddressesColumn – list (newline-separated) of the device IP addresses
- Device.FirstDnsName – first DNS name of the device
- Device.DnsNamesCommaList – comma-separated list of the device DNS names
- Device.DnsNamesColumn – list (newline-separated) of the device DNS names
- Device.Lookup – device name lookup type
- Device.LookupInterval – device name lookup interval
- Device.UserName – device username to connect with
- Device.Password – device password
- Device.ServicesCount – total number of services running on the device
- Device.ServicesUnknown – number of services in unknown state
- Device.ServicesUp – number of running services
- Device.ServicesDown – number of not running services
- Device.NotesCommaList – comma-separated list of notes put for the device
- Device.NotesColumn – list (newline-separated) of notes put for the device
- Device.NetMap – network map the device is put onto
Device type variables
Set in device type properties; available in “Tools” and “Notifications” menus:
- DeviceType.Name – Device type name assigned for the device
- DeviceType.Url – URL field value set for the device type of the device
- DeviceType.NotesCommaList – comma-separated list of notes put for the device type
- DeviceType.NotesColumn – list (newline-separated) of notes put for the device type
Service variables
- Set in service properties; available in “Notifications” menu:
- Service.ProbeTimeout – timeout for the service probe
- Service.ProbeInterval – interval between probing the service
- Service.Status – probe status (up, down, unknown)
- Service.ProblemDescription – problem description
- Service.TimeSinceChanged – time since service status was last changed
- Service.NotesCommaList – comma-separated list of notes put for the service
- Service.NotesColumn – list (newline-separated) of notes put for the service
- Service.TimeUp – total time the service is up
- Service.TimeDown – total time the service is down
Probe variables
Set in probe properties; available in “Notifications” menu:
- Probe.Name – probe name set for the service
- Probe.NotesCommaList – comma-separated list of notes put for the probe of the service
- Probe.NotesColumn – list (newline-separated) of notes put for the probe of the service
- ProbeType.Name – type of the probe set for the service
Network variables
Set in appearance configuration; available in tooltips and labels:
- Network.Name – network name
- Network.SubnetsCommaList – list (newline-separated) of IP subnetworks assigned for the network
- Network.SubnetsColumn – list (newline-separated) of IP subnetworks assigned for the network
- Network.NetMap – network map the network is attached to
- Network.NotesCommaList – list (newline-separated) of notes put for the network
- Network.NotesColumn – list (newline-separated) of notes put for the network
Submap variables
Set in appearance configuration; available in tooltips and labels:
- NetMap.Name – netmap name
- NetMap.NotesCommaList – list (newline-separated) of notes put for the netmap
- NetMap.NotesColumn – list (newline-separated) of notes put for the netmap
Link variables
- Set in appearance configuration; available in tooltips and labels:
- Interface.Name
- Interface.Index
- Interface.Type
- Interface.Mtu
- Interface.Speed
- Interface.PhysAddress
- Interface.PhysAddress
- Interface.AdminStatus
- Interface.OperStatus
- Interface.LastChange
- Interface.InOctets
- Interface.InUnicastPackets
- Interface.InNonUnicastPackets
- Interface.InDiscards
- Interface.InErrors
- Interface.InUnknownProtosInterface.OutOctets
- Interface.OutUnicastPackets
- Interface.OutNonUnicastPackets
- Interface.OutDiscards
- Interface.OutErrors
- Interface.OutQueueLen
- Interface.MediaOid
- Interface.InBitRate
- Interface.InUnicastPacketsRate
- Interface.InNonUnicastPacketsRate
- Interface.InDiscardsRate
- Interface.InErrorsRate
- Interface.InUnknownProtosRate
- Interface.OutBitRate
- Interface.OutUnicastPacketsRate
- Interface.OutNonUnicastPacketsRate
- Interface.OutDiscardsRate
- Interface.OutErrorsRate
Back to Top